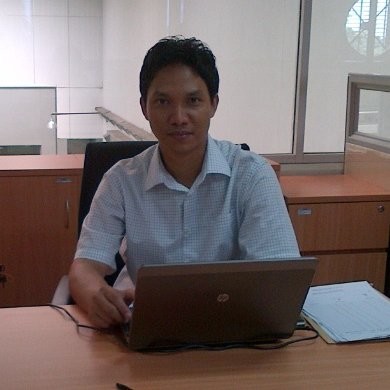
Welcome to D'sciencelabs


This website was created for data science enthusiasts, suitable for beginners to experts, easy to understand, and it can be applied to practice independently by yourself.


Founder


Bakti Siregar profile picture

This Website was developed by Bakti Siregar, M.Sc

He is a Lecturer in the Department of Statistics at Matana University. Currently, He is also working as a freelance Data Scientist at some companies. His job consists in helping companies and researchers to analyse their datasets. He has strong ability with data science frameworks: data pre-processing, modeling, predictions, optimizations, data visualizations and expertise to communicate the result.


RPubs E-book Tutorial Template Reference
2009-2013 Undergraduate USU 2013-2014 Underwriter & Credit Analyst Insurance & Finance 2014-2016 Master Degree NSYSU-Taiwan 2017-2018 Data Analyst Samora Group 2018-Now Lecturer & Freelancer Matana University

Services


Let me help make better use of your data. My expertise can be used to clean, analyze, interpret and visualize your data.

Data Management

Collecing Data, Cleaning and Reshaping. Application Programming Interface (API).

+

Data Mining

Data extraction, Exploratory data analysis, Statistical Modeling, Reproducible data analysis.

+

Data Visualization

Are willing to create neither static nor interactive data visualizations and dashboard web applications.

+

Teaching & Training

Avaliable for Small talks or Workshop on Data visualizations, R, Python, Data analytics and more.

+

Blogs


A few stories about statistics, R, Python, Data visualizations. More or less linked with our world, always related to data


From Data to Viz - A classification of chart types based on input data format

July 2018 - 6 minutes read

I’m delighted to announce a new dataviz project called Data to Viz. It is a classification of chart types based on input data format. It comes in the form of a decision tree leading to a set of potentially appropriate visualizations to represent the dataset. - Read more

Pimp my RMD - A collection of tips for R Markdown

July 2018 - 2 minutes read

R markdown creates interactive reports from R code. I’ve created a document that provides a few tips I use on a daily basis to improve the appearance of my html outputs (my memory aid). This document is built using R Markdown and hosted on Github. - Read more

Portfolio


A glimpse of the projects I've been working on


Contact


Feel free to contact me for any question. For open source projects, please open an issue or pull request on Github. If you want to follow my work, reach me on Telegram. Otherwise, send me an email at dsciencelabs@outlook.com.

Github Telegram Mail